Published 18 February 2025
The "carbon curse" theory suggests that fossil-fuel rich nations tend to have higher carbon emissions than resource poor economies as the abundance of fossil fuels leads to a heavy reliance on these resources for economic growth and energy production. Based on the findings of the 2024 Hinrich-IMD Sustainable Trade Index (STI), Visual Capitalist illustrates how 30 economies compare in carbon dioxide emissions per capita.
(Text by Jia Hui Tee)
Economies rich in fossil fuels such as coal, oil, and natural gas often rely heavily on these resources for economic growth and energy production, leading to higher carbon emissions. The Hinrich-IMD Sustainable Trade Index (STI) evaluates the ability of 30 global trading economies to engage sustainably in trade using 72 economic, societal, and environmental indicators. One key measure, per capita carbon dioxide, assesses the average carbon dioxide emissions produced by an individual within a given territory (excluding biomass/biofuel combustion), reflecting an economy’s overall carbon footprint relative to population size.
High per capita emissions indicate that, on average, individuals in these economies contribute significantly to global carbon dioxide levels, often due to high energy consumption, industrial activities, and reliance on fossil fuels.
As Visual Capitalist illustrates in the final installment of a series showcasing the findings of STI 2024, economies like Brunei and Canada which possess abundant fossil fuel resources, demonstrated poor performance. In contrast, nations such as Papua New Guinea and Bangladesh, characterized by lower levels of industrialization, ranked highest with the lowest per capita carbon dioxide emissions.
Download Carbon dioxide emissions: A resource wealth paradox by Visual Capitalist:

STI 2024 Infographic Series
Comparing climate action of selected STI economies
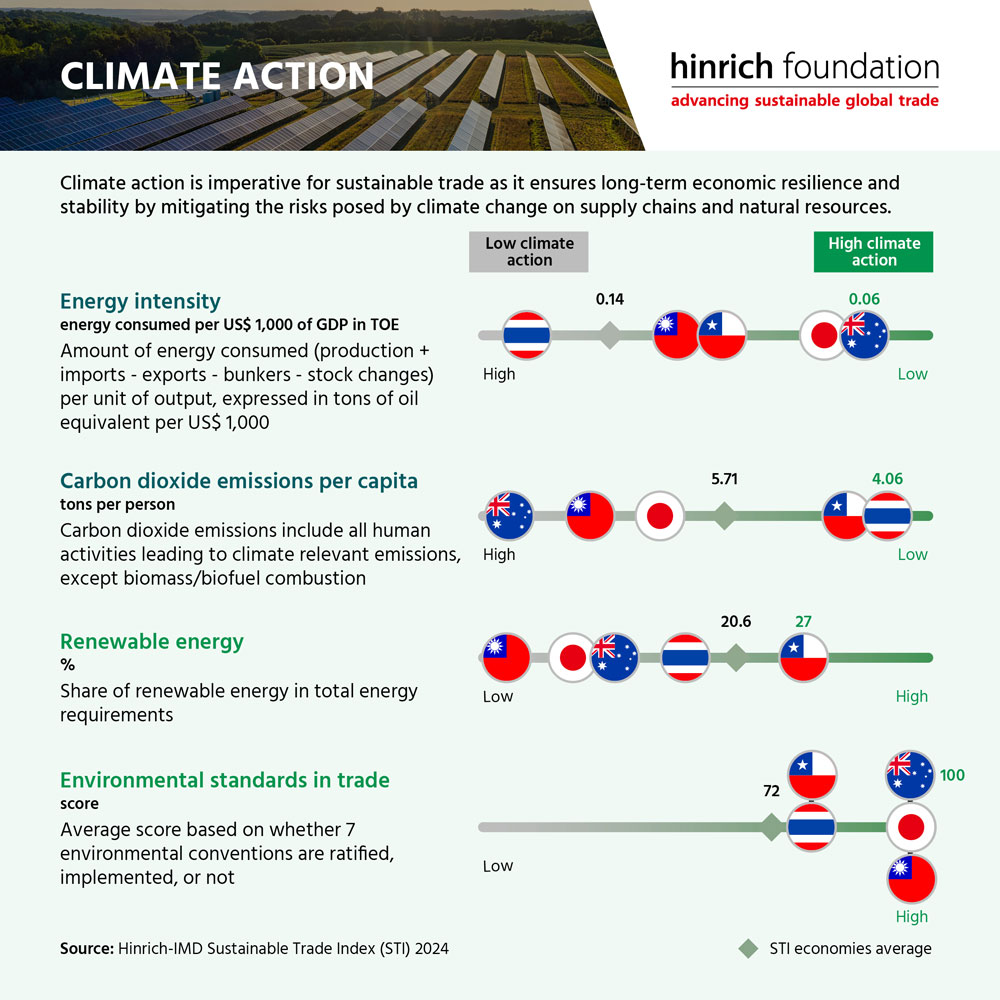
The Hinrich Foundation illustrates how economies that have improved the most in the STI 2024 environmental pillar rankings – Taiwan, Japan, Australia, Thailand, and Chile – compare in measures of climate action. Their differences in energy endowments and level of economic development have led to variations in climate action measures.
- Energy intensity: Australia presents an intriguing paradox. Despite high per capita emissions, the country reports relatively low energy consumed per unit of GDP due its low population density but substantial carbon intensive economic activities such as agriculture, which alone emits 5 million metric tons of carbon dioxide equivalent. Its strong reliance on coal and oil for electricity generation has also disproportionately contributes to its emissions. Japan, like Australia, showcases a similar paradox. Although, Japan reports low energy consumption per unit of GDP, it still has relatively high carbon dioxide emissions per capita due to its dependence on imported fossil fuels. In the aftermath of the 2011 Fukushima nuclear disaster, Japan’s nuclear power generation declined sharply, with its share of electricity generation falling from 29% in 2010 to 5.5% in 2023. Consequently, Japan had to increase its reliance on fossil fuel imports to meet its energy demands.
- Carbon dioxide emissions per capita: Thailand, on the other hand, has relatively low per capita emissions compared to Australia, yet its energy consumption per unit of GDP is higher due to rapid industrialization and urbanization. To meet the rising energy demand while managing emissions, Thailand has minimized coal usage and increased its reliance on gas instead of oil. Additionally, it has made substantial investments in renewable energy sources like solar, wind power, and biomass, which help reduce the carbon intensity of its energy consumption while maintaining high overall energy use.
- Renewable energy: Chile has incorporated 27% renewable energy into its total energy mix (STI 2024). This achievement is largely due to investments in solar, wind, and hydroelectric power, facilitated by its natural endowments. Chile’s coastlines and mountain ranges provide conditions for wind and hydroelectric power, while the Atacama Desert provides optimal conditions for solar energy. Additionally, the Chilean government aims to phase out coal by 2030 and has enacted policies and incentives to support the growth of renewable energy. On the other hand, Taiwan’s share of renewable energy is low as relies almost entirely on imported fuels (96.7%) for energy supply. Moreover, its high population density and limited land availability put constraints on expanding domestic renewable energy installations.
- Environmental standards in trade: Taiwan, Japan, Australia, Thailand, and Chile have taken significant steps to align their domestic policies with environmental sustainability, having ratified international conventions in support of environmental goals. Australia, Japan, and Taiwan have committed to all seven environmental conventions tracked by the STI, including the Basel Convention, Convention on the Prevention of Marine Pollution, and the Vienna Convention for the Protection of Ozone Layer.
The intricate relationship between a nation's resource endowments, economic development, domestic policies, and trade practices significantly influences its carbon emissions. Resource-rich nations often grapple with higher emissions due to fossil fuel dependency. However, investing in green industries and diversifying energy sources can create pathways for sustainability, further reinforced through international trade.
Domestic policies are pivotal in shaping a nation's environmental trajectory. Progressive policies, such as Chile's investment in renewable energy or Australia's commitment to close all coal-fired plants by 2038, demonstrate how government initiatives can drive sustainability despite natural resource wealth. Trade practices also influence carbon emissions, presenting both challenges and opportunities for environmental sustainability. Aligning trade policies with global environmental goals through international conventions can foster sustainable practices and decarbonize global supply chains.
A comprehensive approach integrating resource management, economic strategies, robust domestic policies, and sustainable trade practices is essential for mitigating carbon emissions and promoting environmental responsibility.
Download the STI 2024 report and interactive index for more insights and data.
© The Hinrich Foundation. See our website Terms and conditions for our copyright and reprint policy. All statements of fact and the views, conclusions and recommendations expressed in this publication are the sole responsibility of the author(s).
Author
Visual Capitalist
Related Articles