WTO
WTO Global Trade Outlook and Statistics April 2025
Published 29 April 2025
The outlook for global trade has deteriorated sharply due to a surge in tariffs and trade policy uncertainty. As of 14 April, the WTO’s new estimate for 2025 is nearly three percentage points lower than it would have been without recent policy shifts. Explore our analysis of the WTO’s April edition of its Global Trade Outlook.
Here’s how to use the World Trade Organization’s (WTO) Global Trade Outlook and Statistics April 2025.
Why is the Report important?
With drastic trade policy shifts in the United States, including adoption of high levels of tariffs across goods and trading partners, and triggering retaliatory tariffs, the global trading system is in period of considerable change. This report on the role of tariffs in international trade highlights the impact of tariffs in place before these changes, which economies impose and face the highest tariff levels, and how tariffs can have an impact on economic development. It provides important context and information at a time when tariff imposition is poised to reshape global trade flows and value chains.
What’s in the Report?
The Report includes four principal sections followed by appendix tables:

Outlook for world trade in 2025 and 2026
- At the start of 2025 WTO economists expected continued expansion of world trade, but new tariffs implemented since January have led to a significant downgrade in the outlook for merchandise or goods trade – a -2% contraction in 2025 - and a reduction in outlook for services trade – with growth limited to 4.0%; tariff disturbances follow a strong year for world trade in 2024 when goods trade grew 2.9% and services trade grew 2.8% (p. 3)
- The unprecedented recent shifts in trade policy pose challenges for economic forecasting given the lack of recent precedents; WTO economists have made pre- and post-tariff projections by creating policy simulations through its Global Trade Model reflecting measures in place as of April 14, 2025; the model predicts a downward adjustment in global output, with GDP growth reaching only 2.2% in 2025, 0.6% less than earlier projected. (pp. 3-4, Chart 1)
- The impact of tariff measures on goods trade may differ sharply across regions, with North America subtracting 1.7% from global trade growth in 2025 and Asia growing only 0.6%, with other regions’ contributions also reduced, but by less; this is a reversal from 2024 when trade grew faster than predicted. (pp. 4-6, Chart 2, Table 1)
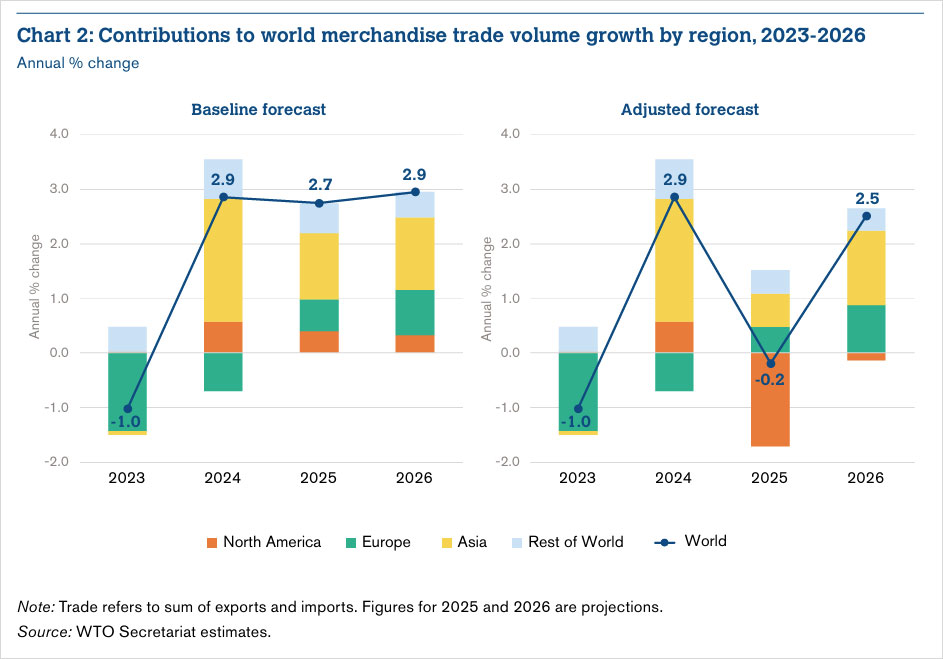
- In 2024, Europe was the largest downward influence on trade; in value terms, goods trade increased by 2% in 2024, characterized by large swings in particular product categories; prices played a small role in nominal trade growth in 2024; trade in agricultural products rose 3% in value terms, significantly affected by increases in coffee, tea and cocoa prices; trade in fuels as well as energy prices and prices for manufactured goods all fell in 2024. (pp. 5, 7-8, Charts 3-5)
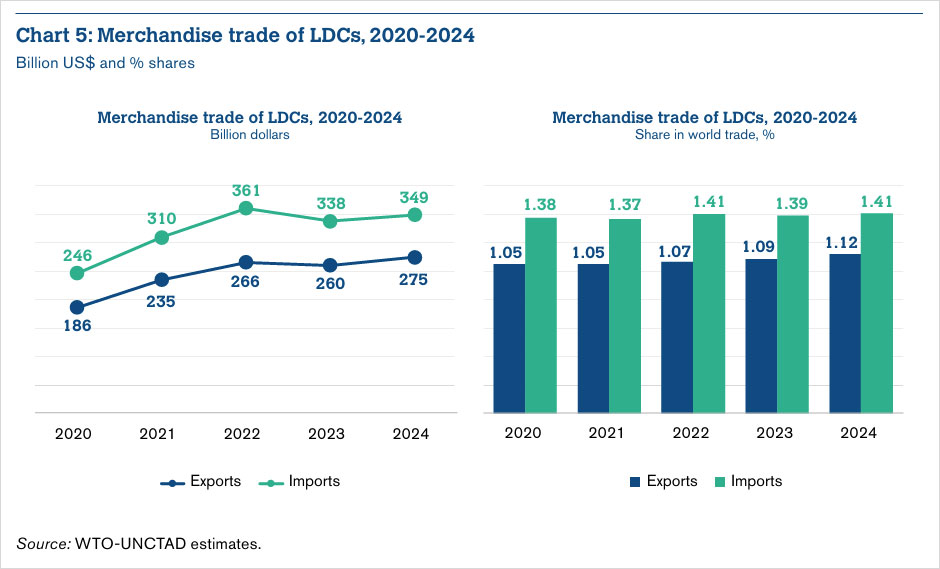
- Least developed countries (LDCs) are projected to see a positive impact on goods trade flows in 2025 despite tariffs and uncertainty, because their export structures will allow them to benefit from trade diversion as Chinese goods face higher tariffs; LDC goods trade flows rebounded in 2024 after contracting in 2023; the share of LDC goods in world exports hit an all-time high of 1.12% in 2024. (pp. 7-8, Chart 5)
- Adjusted for trade policy uncertainty, services trade volume will expand by 4.0% in 2025 compared to originally projected growth of 5.1%; although tariffs are limited to goods, their effects ripple across the broader economy including on services trade; demand for international travel could be the first sector affected by economic uncertainty; intermediate services that support goods trade or the production of other services will be affected by the current economic context and may face a decline in demand. (pp. 9-10, Table 2, Chart 6)
- Under the revised forecast, most services growth in 2025 will originate from Europe; Asia’s services exports are projected to increase by 4.4%; North America will slow to 1.6% in 2025, with even greater declines expected for the Middle East; Africa, South and Central America and the Caribbean, are expected to see declines in 2025. (pp. 10-11, Chart 7)
- In 2024 services accounted for 26.4% of global trade, totaling US$8.69 trillion, an annual growth of 9% in contrast to goods trade annual growth of 2%; services trade grew 13% in Asia, over 9% in South and Central America, 8% in both Europe and North America, and 3% in Africa but contracted by 1% in the Middle East; transport and travel services trade increased significantly in 2024, especially in Asia; other commercial services, accounting for around 60% of services trade, expanded by 8% in 2024; other business services and computer services expanded in 2024, and growth of digitally delivered services outpaced goods trade. (pp. 11-16, Charts 7 and 9-10)
- Container throughput of major international ports is a key indicator of global goods trade volumes; as of February 2025, tariff increases were not yet evident in throughput data; in the first two months of 2025, global container throughput was up 5.3% compared to the same period in 2024, indicating a strong underlying growth in trade. (pp. 16-17, Charts 11-12)
How to apply the insights
-
This section provides the key statistics on the state of trade flows in 2024 and key projections for 2025, incorporating the reality of current and ongoing trade policy uncertainty and high levels of tariffs already imposed by the Trump Administration and its trading partners.
-
This resource is essential for policy makers and analysts who need to quickly grasp the potential impact of today’s changing environment for trade.
Drivers of trade and output; Fragmentation of world trade
- Macroeconomic conditions in 2024 were more favorable for trade than in 2023 because of the global easing of inflation, allowing growth in real incomes and consequent increased demand for goods, along with continued solid growth in services trade; at the start of 2025 the WTO expected continued trade expansion for 2025 and 2026; under the combined effects of geopolitical tensions, new trade restrictions, and growing trade policy uncertainty, the trade policy environment has deteriorated and greater trade restrictiveness and uncertainty are now expected to act as a drag on growth; trade policy uncertainty, volatility, and restrictiveness have a two-fold impact: as a direct trade cost and affecting households’ consumption and savings behavior, ultimately having negative effects on aggregate demand and trade. (pp. 17-18)
- While in the short term, tariffs can boost domestic production, raise government revenue and improve terms of trade, over the medium to long-term, higher import tariffs generally have an overall net negative effect on economic activity and trade; tariffs are a tax on imported products that can affect the world price of a product, and can have an impact on consumer prices and exports, the real and nominal exchange rates, inflation, competitiveness, and aggregate, bilateral, and sectoral trade imbalances. (pp. 18-20, Box 2)
- Uncertainty fosters increased prudence in decision-making: dampening business confidence, reducing investment, and impairing growth; uncertainty can affect prospects for continued disinflation and inflation expectations; with tariffs, prices and costs may be permanently impacted and consumer and investor sensitivity to price levels may affect their decision-making; trade policy uncertainty ultimately depends on the number and full extent of policy measures and level of restrictiveness to market access relative to what prevailed previously. (p. 18)
- Data has shown fragmentation in global trade flows in response to recent shocks like the pandemic, war in Ukraine, and policy uncertainty, yet there is no clear evidence of a broader shift toward regionalization or near-shoring; foreign direct investment appears to be following geopolitical alignments; fragmentation in investment flows may reinforce geopolitical alignment in trade over time; if global uncertainty rises and spreads, friend-shoring may lose momentum; if decoupling continues between the largest global economies and tit-for-tat tariff increases spread, global real GDP could reduce significantly in the long run, with low-income economies losing the most. (pp. 20-21, Chart 13)
Analytical Chapter: Modelling trade policy uncertainty and changes in tariffs
- Trade policy uncertainty (TPU) matters because firms making long-term commitments depend on stable and predictable trade policies; when uncertainty around future tariffs and trade relations increases, firms may delay or scale back investments, reducing trade flows, limiting productivity gains, and lowering economic growth. (pp. 22)
- TPU can be quantified through analyzing "tariff water": the difference between the maximum tariff a member can apply under WTO rules ("bound tariff") and the rate a member actually applies; this gap is a key structural indicator of policy space; a large gap implies that a government has significant leeway to raise tariffs without breaching international commitments, creating uncertainty for businesses - a risk that costs could rise unexpectedly. (pp. 22-23)
- News-based economic uncertainty indices, firm-level surveys, historical events that reduce policy uncertainty, and policy reversals with immediate negative effects are all methods that can capture TPU dynamics. (p. 23)
- Tariff increases and TPU impacts are analyzed in the WTO Global Trade Model (GTM), with four scenarios considered in the analysis:
- Scenario i assumes heightened uncertainty surrounding trade with the US, that trade water increases by 25% on goods trade with all trading partners, a trade elasticity of 5, no surge in probability of tariff increases, increasing long-run TPU by about 2.4%;
- Scenario ii builds on scenario I, adding all tariff increases since the beginning of 2025 until 14 April 2025;
- Scenario iii adds all reciprocal tariff rates initially announced by the US for all trading partners;
- Scenario iv adds a broader proliferation of uncertainty with TPU extending beyond the US and affecting bilateral goods trade between all economies. (pp. 23-26)
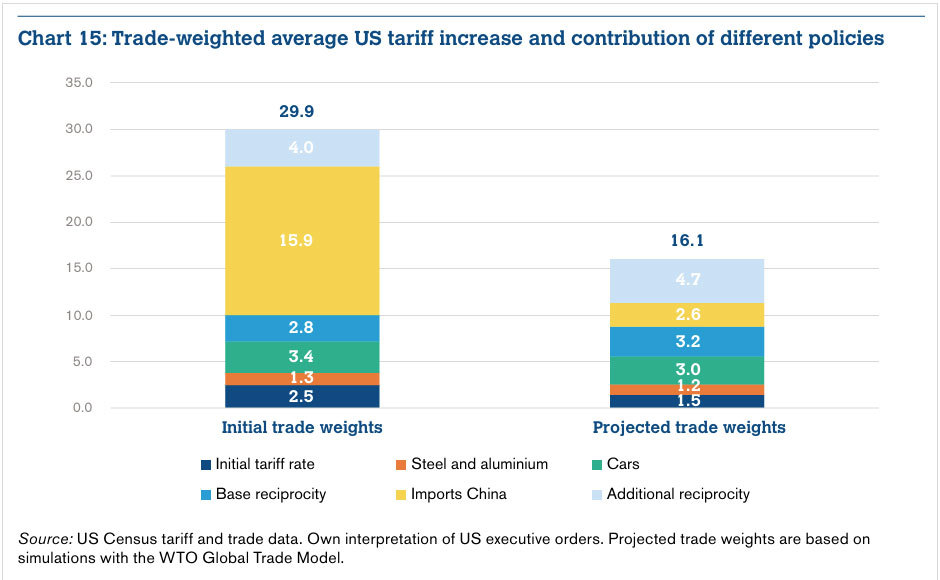
- Under scenario ii, the average US tariff rate without reciprocal tariffs increases to 9% using 2024 trade weights and decreases to 11.4% with projected 2025 trade weights as trade diversion leads to a shift away from imports from China towards other sources of supply. (p. 26, Chart 15)
- Scenario i simulations suggest that TPU has a meaningful dampening effect on trade flows, leading to lower exports and weaker economic activity; TPU in trade with the US reduces the projected growth in global exports and global GDP by 0.5% and 0.25%, respectively, with most of the losses occurring in North America given that a large share of trade with the US takes place within North America (pp. 26-27, Chart 16)
- Scenario ii predicts a 3% decline in global real goods exports and a 61% reduction in global GDP in 2025, demonstrating that one-sixth of trade contraction is attributable to TPU alone; for GDP about 40% of the impact comes from TPU; the fall in exports comes both from real appreciation and increased prices of intermediate inputs; LDCS see a projected rise in exports because of expected greater opportunities for export to the US in sectors where China currently has a large share. (pp. 26-27, Chart 16)
- Scenario iii sees a reduction in global trade growth of 3.5% with the additional loss in global GDP relatively limited to 0.65%; additional trade reductions are concentrated in Europe or Asia; because of trade diversion, South and Central American trade reduction could fall slightly. (p. 27)
- Scenario iv assumes TPU could spread because of economic pressures for trade-restrictive measures, geoeconomic considerations leading to political pressure to introduce tariffs or other trade-restrictive measures, and/or the effects on the credibility of the principles of the multilateral trading system; global real goods exports would fall further to a cumulative decline of 4.3%, with global GDP losses reaching 1.12%; broader uncertainty would likely weigh more heavily on high-income economies though LDCS would be particularly affected and their projected GDP losses would rise to 0.74%. (pp. 27-28)
- There is a strong negative correlation between projected fall in GDP and the share of goods exports to the US, with Mexico and Canada projected to incur large GDP losses because of their exposure to increased TPU given their high export shares to the US; most regions are projected to see a fall in exports to the US with the largest reduction for China; in sectors where China currently has a large market share, other economies can be expected to gain an advantage in export opportunities; most regions will see increases in Chinese imports, with North and South America (ex-US) expected to see the highest increases. (pp. 28-29, Charts 17-18)
How to apply the insights
-
This section comprehensively explains the process of modeling trade policy uncertainty created largely by the sudden shifts in US trade policy under the Trump Administration.
-
It explains the underlying assumptions of the analysis, why these choices were made, and the caveats that readers should consider in understanding the model.
-
It also gives four projected scenarios based on real policies adopted or threatened.
-
It is the best estimate so far of the trade impact of the dramatic trade policy shifts of the past three months.
Conclusion
The report arrives at a time when the United States, previously a champion of the rules-based order for international trade and the principles of trade liberalization, has suddenly reversed course and imposed game-changing tariff levels on all trading partners. This report gives a first analysis of the potential impact of these tariffs on the global economy and provides a new tool for analysis in a time of increasing uncertainty.
Complementary reports and analysis
Hinrich Foundation
- Defending the multilateral trading system: Survey findings on WTO reform
- How we should move forward in Trump’s turbulent trade world
- Responding to Trump 2.0: A Committee to Save the Rest of the World
External Resources
-
World Trade Report 2024 — Trade and inclusiveness: How to make trade work for all - WTO
-
Trump's trade war timeline 2.0: An up-to-date guide – Peterson Institute for International Economics
© The Hinrich Foundation. See our website Terms and conditions for our copyright and reprint policy. All statements of fact and the views, conclusions and recommendations expressed in this publication are the sole responsibility of the author(s).