Trade policy
How governments back the largest manufacturing firms
Published 04 March 2025
As the world faces mounting challenges from climate change, pandemics, and supply chain constraints, more governments are turning to industrial subsidies to bolster manufacturing to tackle these challenges. As analysts strive to understand how much is being spent and how successful the spending is, the OECD has developed a new database to plumb the available evidence on the link between industrial policy and the manufacturing sector.
Here’s how to use the OECD Trade Policy Paper entitled How Governments Back the Largest Manufacturing Firms.
Why is the paper important?
As the paper’s authors state, "government support has intensified in recent years, but evidence on the nature and scale of industrial policies is scarce". The new OECD "MAnufacturing Groups and Industrial Corporations (MAGIC)" database provides an improved dataset that policymakers and analysts can use to understand how governments are providing subsidies, to whom, and observable patterns over time. This paper introduces the MAGIC database and presents a summary of key findings to date, while noting the need to expand the scope of the database in order to provide better evidence in the future.
What’s in the paper?
The report includes two principal sections:

The measurement of government support
- Government support has long been an issue in trade policy but interest in it has increased due to challenges like climate change and the Covid pandemic; comprehensive evidence on the scope and scale of industrial subsidies and their implications domestically and internationally is limited due to a lack of data, making it difficult to know which are benign and which are harmful, complicating subsidy design to increase effectiveness and minimize competitive distortions; this paper fills gaps from the OECD MAGIC database. (p. 5)
- Assessing the scope and scale of government subsidies and their evolution over time is difficult due to a persistent lack of reliable data comparable across countries, reflecting both methodological difficulties with quantifying government support and the unwillingness of governments to disclose measures and associated costs; data availability on subsidies varies among sectors and countries as well as over time. (p. 5)
- More efforts are being made to quantify government support in industrial sectors in a consistent manner; the MAGIC database identifies and quantifies industrial subsidies at the level of individual subsidy recipients (large manufacturing firms), differing from other approaches identifying subsidies based on the providing authorities; firm-level information uncovers subsidies provided by less transparent jurisdictions and at various levels of government and through state enterprises as intermediaries; limits to this approach include sampling and low-quality disclosures from firms. (p. 6)
- The MAGIC database is a confidential firm-level database combining financial and economic data and estimates of government support at the level of each industrial group from 2005-2022, to improve understanding of the scope and scale of government support in manufacturing and to enable analysis of how this support affects firms’ decisions and markets; it covers sectors producing either durable goods or industrial raw materials, mostly for other businesses; 482 consolidated industrial groups are covered – the largest globally by sales output or capacity in 14 sectors in Table 1 and jurisdictions in Table 2; multinationals in the database may combine subsidy amounts obtained in multiple jurisdiction in which they operate. (pp. 7-9, Tables 1-2)
- The MAGIC database does not identify design characteristics and policy objectives of subsidies, but can reveal the role of subsidies in shaping the market in a given sector over time; it covers three kinds of subsidies – an improvement in data availability but by no means an exhaustive list:
- Annual values for government grants;
- Estimates of corporate income tax concessions; and
- Below-market borrowings (pp. 9-10)
Key stylized facts about industrial subsidies
- There are five consistent patterns in the way governments offer support to companies across industrial sectors and years:
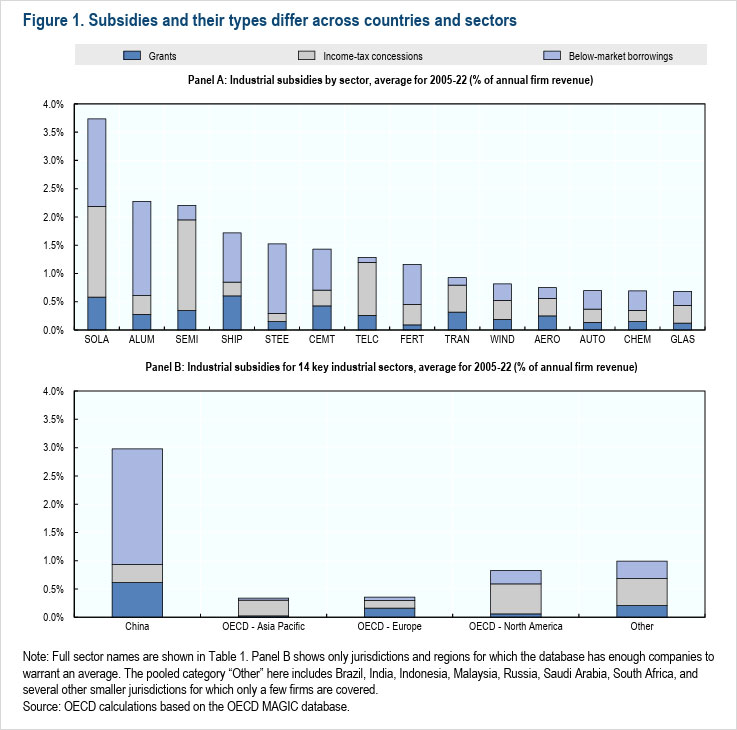
- Subsidies and their types differ across countries and sectors – governments use a variety of instruments to support industrial firms with no one instrument taking overwhelming precedence, though some are more commonly used in certain sectors owing to industry specification; there are notable differences in the mix of instruments used in different jurisdictions; subsidies relating to firm value are larger for firms based in China than in other jurisdictions; there are important differences between firms whose production activities and sales are international with implications for subsidies they receive. (pp. 11-13, Figure 1, Table 3)

- Subsidies are pervasive – less than 3% of all firms did not receive any subsidies in any year; no subsidies were reported for only 8% of firm-year observations; around half of firms received at least one type of government support every year during the period for which data are available; 90% of firms benefited from at least one subsidy for half of the period for which data are available; the receipt of government support is pervasive although the precise form of this support can vary over time; the ubiquity and persistence of subsidies may be due to their nature as parts of a tax code or to multi-year industrial policy strategies requiring sustained government support. (pp. 13-14, Figure 2)
- Subsidies are relatively modest on average in most countries, but their distribution is highly skewed – the median annual subsidy across all firms and the whole sample is 0.7% of revenue; subsidies are larger relative to firms’ investment in fixed tangible assets with a median of nearly 9% - measuring subsidies in relation to investment is more relevant as they are often tied to investments in productive assets; even if small, subsidies can still have a significant economic impact on individual transactions and investment decisions; distribution of subsidies is highly skewed given instances of relatively large subsidies for a few firms; very high subsidies are concentrated mainly in China; distribution of subsidies is very skewed for each type of subsidy covered; subsidies increase less than proportionally with the size of companies, suggesting explicit or implicit upper limits on the amounts of subsidies that governments provide. (pp. 14-16, Figures 3-4)
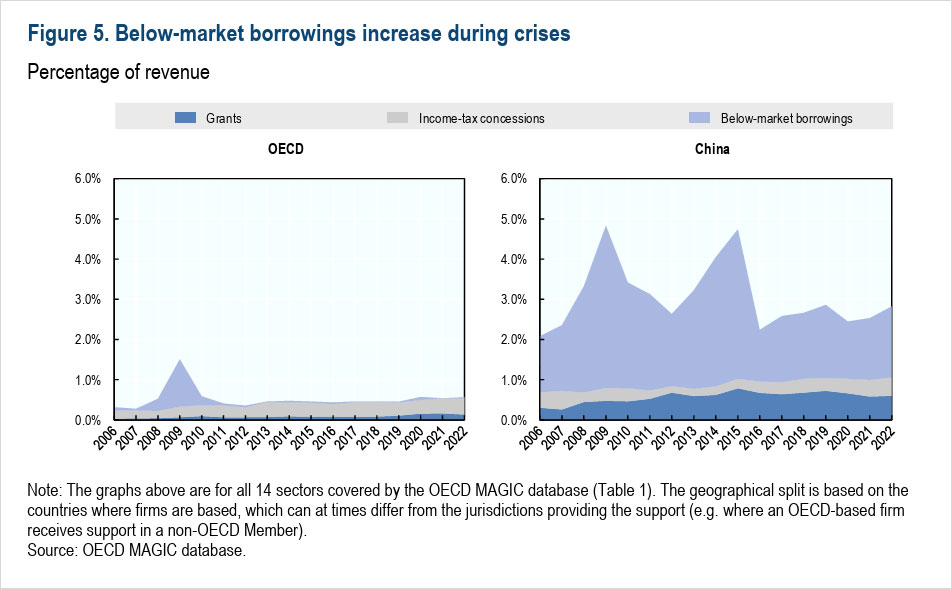
- Governments often rely on below-market finance to help distressed firms – below-market borrowings are common in capital-intensive heavy industries and in China, but also to support distressed firms during crises; in China, support through below-market borrowings is widely used even in normal times; governments have also given emergency non-market equity to help ailing companies both in times of distress and for strategic purposes such as industrial upgrading; while below-market finance peaks in times of crisis, it can also form part of a broader eco-system of government support in the context of a state-led manufacturing push; governments rely more on below-market financing during crises due to tighter financial conditions restricting firms’ access to financial markets and the ability to mobilize this financing quickly. (pp. 17-19, Figure 5)
- State enterprises receive relatively more grants and below-market borrowings – state enterprises are generally larger recipients of support than their private competitors; government ownership of companies correlates positively with the amount of subsidies they receive relative to their size in terms of below-market borrowings and government grants, though the correlation is negative for income-tax concessions. (p. 19, Figure 6)
- Subsidies and their types differ across countries and sectors – governments use a variety of instruments to support industrial firms with no one instrument taking overwhelming precedence, though some are more commonly used in certain sectors owing to industry specification; there are notable differences in the mix of instruments used in different jurisdictions; subsidies relating to firm value are larger for firms based in China than in other jurisdictions; there are important differences between firms whose production activities and sales are international with implications for subsidies they receive. (pp. 11-13, Figure 1, Table 3)
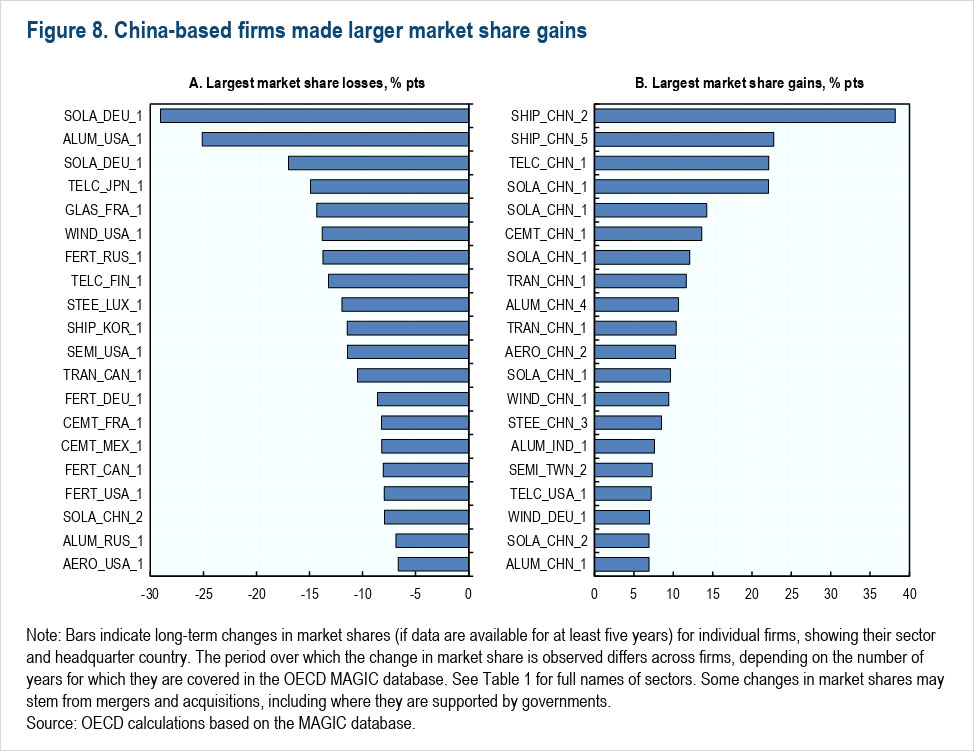
- While generally stable, market shares of large manufacturing firms reveal a shift away from OECD member countries and toward China - China-based companies have seen more frequent gains than losses in market share, while the opposite is true for firms in other jurisdictions; gains in the market position of China-based firms at the cost of OECD-based firms are also visible at the regional level for most sectors but not all. (pp. 20-22; Figures 7-9)


How to apply the insights
-
This section highlights the key insights gained from the database, revealing interesting patterns about the provision of subsidies across firms and over time, and especially highlighting distinct practices and outcomes relating to China.
-
Policymakers should note that these findings also raise questions that should prompt further information gathering and analysis.
Conclusion
The OECD trade policy paper provides a new, improved, and different lens for assessing the scope and use of subsidies around the world, and should be incorporated into the toolbox of any policy maker or analyst seeking to understand the use of subsidies in today’s global economy.
Complementary reports and analysis
Hinrich Foundation
- Fighting subsidies with subsidies
- Say hello to industrial policy, but never goodbye
- Disciplining China’s state capitalism through international trade rules: Regaining the missed opportunity
- CHIPS as usual: A defense of US industrial policy
External Resources
-
Trade Implications of China's Subsidies - International Monetary Fund
IMF research finds that China’s subsidies promoted Chinese exports and limited imports. -
Rethinking international rules on subsidies – Council on Foreign Relations
A report on updating the WTO toolbox on subsidies. -
Modern industrial policy and the WTO – Peterson Institute for International Economics
A report raising questions about the use of modern forms of industrial policy and WTO rules. -
New Industrial Policy Observatory – Global Trade Alert
A database of "new industrial policy" measures undertaken since January 2023.
© The Hinrich Foundation. See our website Terms and conditions for our copyright and reprint policy. All statements of fact and the views, conclusions and recommendations expressed in this publication are the sole responsibility of the author(s).