Published 10 June 2025
As US tariff actions fuel global trade volatility, understanding their impact on trade flows is key to navigating today’s complex dynamics. The United Nations Trade Intelligence and Negotiation Adviser tariff simulation dashboard offers a robust framework to model and assess the effects of shifting trade policies.
The following images are republished with the permission of United Nations Economic and Social Commission for Asia and the Pacific (UNESCAP) from the UN Trade Intelligence and Negotiation Adviser (TINA) Tariff Simulation dashboard.
The UN TINA Tariff Simulation dashboard is an interactive analytics tool that allows policymakers, trade negotiators, businesses, and researchers to assess how changes in tariff rates can affect trade flows and economic outcomes. The TINA platform is a digital toolkit designed to support informed trade decision-making.
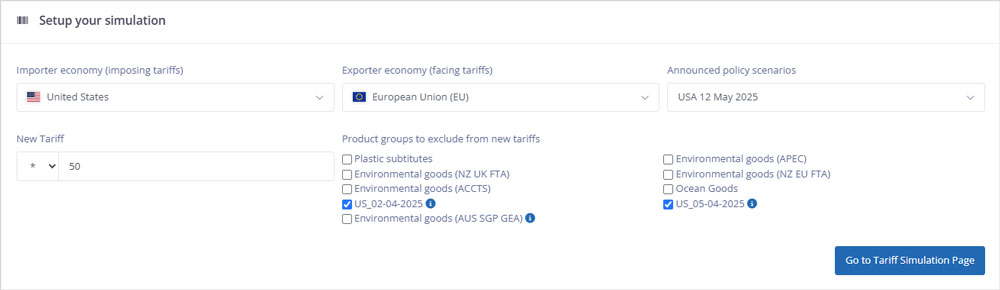
The Tariff Simulation dashboard enables users to conduct partial equilibrium simulations based on real-world tariff policy scenarios. Users can select specific country pairs, adjust current or proposed tariffs on commodities (at the HS6 level), and instantly generate insights on import changes, trade diversion, and sector-level exposure. It estimates the changes in import values and overall trade flows due to the tariff adjustments.
Drawing on detailed bilateral trade data, import demand elasticities, and ad valorem equivalents, the tool provides evidence-based analysis to help shape smarter tariff responses and trade negotiations. Its "what if" analysis feature lets users test hypothetical or proposed tariff changes to understand their potential trade and economic impacts before actual implementation. This enables government and businesses to prepare for a wide range of scenarios and evaluate alternative policy responses using data-backed evidence.
Explore TINA Tariff Simulation dashboard by UNESCAP:

Figure 1: Example of a simulation set up
TINA has recently been used to assess the implications of the US tariff announcements made in April and May 2025. Simulations indicate that countries such as Cambodia, Vietnam, and Bangladesh could lose up to 94% of their direct exports to the US. For example, in case of Cambodia, national-level simulations suggest that the April 2 tariffs could reduce output by as much as 13%.
Figure 2: Example of commodity-wise tariff changes
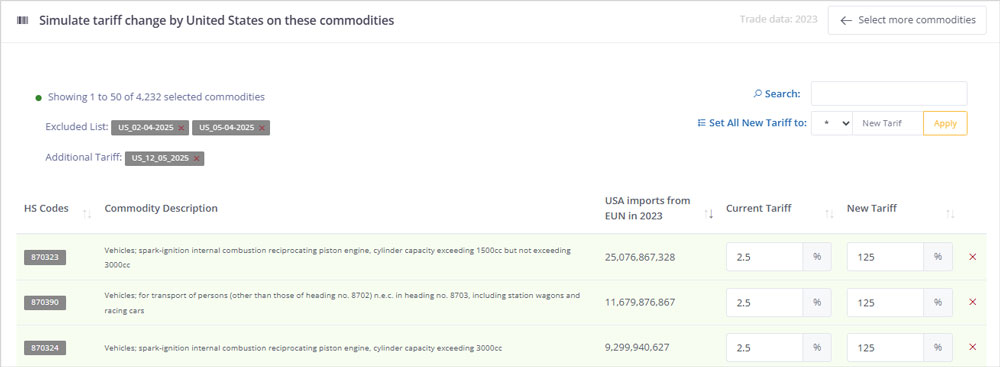
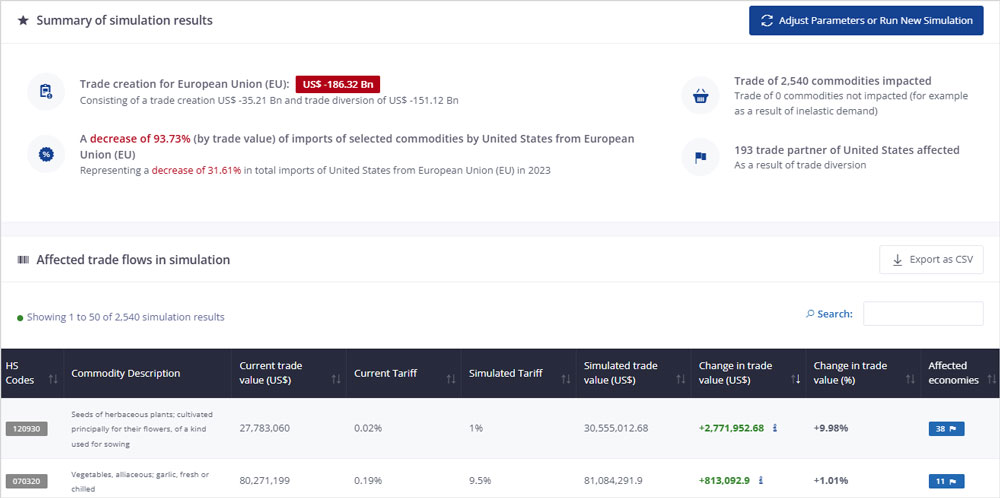
Figure 3: Example of simulation results
Beyond bilateral impacts, the dashboard helps estimate third-party and pass-through effects including how tariffs imposed on one economy may indirectly affect others via global value chains. In addition to tariff scenarios, the TINA suite includes dashboards for non-tariff measures (NTMs) and trade facilitation, offering a comprehensive platform for analyzing trade policy in a fast-evolving global environment.
As economies grapple with rising protectionism and trade fragmentation, tools like TINA provide critical support, especially for developing economies facing resource constraints. TINA enables users to test tariff scenarios, examine product-level vulnerabilities, and make better-informed strategies in a world of heightened uncertainty.
© The Hinrich Foundation. See our website Terms and conditions for our copyright and reprint policy. All statements of fact and the views, conclusions and recommendations expressed in this publication are the sole responsibility of the author(s).

Author
UNESCAP
The Economic and Social Commission for Asia and the Pacific (ESCAP) serves as the United Nations’ regional hub promoting cooperation among countries to achieve inclusive and sustainable development.
Have any feedback on this article?
Related Articles